Jassimmrat K. Bhatia (student) | Heritage International Xperiential School, Sector-58, Gurugram, Haryana, 122018, India
Abstract
No nation is untouched by domestic violence, and it is well-known that it seriously impacts women’s health and well-being. The present study aims to assess the prevalence and characteristics of domestic violence during the COVID-19 pandemic, as compared to the years before, using National Family Health Survey (NFHS) data from 2015-16 and 2019-21. The NFHS collects data nationally through surveys covering various topics, including domestic violence. For this study, graphical representations were created of physical, sexual, and spousal violence and marital control to compare data. Analysis showed that the prevalence of domestic violence has increased during the COVID-19 lockdown, and there has been no significant improvement in domestic violence rates, despite the disparity in the age of respondents between the two surveys. This indicates that more social and governmental programs and policies need to be put forth in place to improve the prevalence of domestic violence in India.
Key Words
Social Science; Sociology; Domestic Violence; NFHS; Data; Prevalence; COVID-19; Lockdown
Introduction
Domestic Violence threatens women’s life, security, and fundamental rights of self-preservation and respect globally. Defined as a pattern of behavior in any relationship—marriages, living together, dating— used to gain or maintain power and control over an intimate partner,1 Domestic Violence can occur in various forms and undermine through physical, sexual, emotional, economic, or psychological aspects, and even as threats of actions that influence another person.2 It may also increase the risk of acquiring HIV in some settings.3
Although prevalent since the 15th century when the Catholic Church established its “Rules of Marriage,” recommending husbands beating their wives as an accepted form of discipline that would benefit their soul, Domestic Violence came into light as a significant issue with the influence of the Women’s Liberation Movement in the 1960s and 1970s.4 Globally, an estimated 736 million women—almost one in three—have been subjected to physical and sexual violence by an intimate partner, non-partner sexual violence, or both at least once in their life (30% of women were aged 15 and older).5
Globally, a woman’s right to live free from violence is upheld by international agreements such as the Convention on the Elimination of All Forms of Discrimination against Women and the 1993 UN Declaration on the Elimination of Violence against Women.6 Social movements such as the #MeToo movement, started by Tarana Burke in 2006, and the UNiTE campaign of 16 days of activism to end violence have also sparked global movements to act upon abuse.7
Nationally, The Indian Parliament recognizes domestic violence, a rampant and deep-rooted issue in the Indian subcontinent, as “physical, sexual, verbal, emotional, and economic abuse against women by a partner or family member residing in a joint family.”8 Women are subjected to violence from both husbands and members of the natal and marital home. They remain less privileged than boys regarding their position in the family and society and access to material resources.9 Marriage continues to be regarded as essential for a girl; to control a woman’s sexuality by labelling it as a family reputation that needs to be “handed over” to the husband who practically “owns” their wife.9 In India, while boys experience greater freedom, girls face extensive limitations on their ability to make decisions regarding their work, education, marriage, and social relationships.10 One in three women in India is likely to have been subjected to violence of a physical, emotional, or sexual nature by their partners.11 The differences in educational attainment level or marital age between spouses, lack of autonomy within the home, dowry pressure, childhood abuse, unemployment, alcoholism, and poverty are all linked to high rates of domestic violence in India.9
The Constitution of India not only grants equality to women but also empowers the State to adopt measures in favour of women to neutralize the cumulative socio-economic, educational, and political disadvantages faced by them, as is mentioned in articles 14, 15, 16, and 39.12 Furthermore, the Indian Penal Code condemns various crimes that come under domestic violence such as all forms of rape, torture, and harassment. Apart from the legislation, the government ensures several social policies and grants to protect victims and survivors of domestic violence, like helplines, safe houses, workshops, etc.13 However, the gap between laws and their effective enforcement leads to backward traditional and cultural practices, insensitivity of law enforcement machinery, and gender stereotypes.14
The occurrence of domestic violence differs from state to state in India. At the same time, women in the South report fewer cases of violence against them than their counterparts in the North. In-depth qualitative studies have found considerable under-reporting in the data.9 The data peaks in Maharashtra, Haryana, and their eastern counterparts, with Uttar Pradesh topping the list with 59,853 incidents.15
The lockdown during the COVID-19 pandemic worsened domestic violence in the country. An increase in the prevalence of domestic violence at 32.5% was seen during the lockdown, with the most common form being verbal abuse and most of the abuse committed by the spouse or mother-in-law. While the medical community focused on controlling the spread of COVID-19, women who experience domestic violence may have been neglected, considering healthcare system challenges caused by the pandemic, as mentioned in the paper.16 A heightened risk was reported due to house quarantine, living near the abuser 24*7 with no means of escape.17 Also, it was linked with socio-economic variables such as homelessness and poverty. However, it is reported across all countries and in all socio-economic groups.18 Additionally, social isolation, exposure to economic and psychological stressors, an increase in negative coping mechanisms (such as alcohol misuse), and an inability to access usual support mechanisms are other cited reasons.17
Methodology
Research Aim: This research aims to compare the domestic violence stats based on different demographics over the two NFHS reports to identify and understand the possible socio-ecological reasons for the same.
Research Design: This quantitative analysis compares the NFHS India 2015-16 and 2019-21.19. The NFHS is a large-scale, multi-round survey conducted in a representative sample of households throughout India. The survey provides state and national information on domestic violence statistics across demographics, among other categories. For domestic violence, the NFHS considers physical, sexual, and emotional violence, marital control, and spousal violence. The fourth NFHS, conducted in 2015-16, sheds light on the much-changed state of domestic violence in India, whereas the fifth NFHS, undertaken in 2019-21, accounts for the pandemic in its results. Both surveys present statistics that require to be reflected upon.
Hypothesis: It is hypothesized that domestic violence statistics peaked during the COVID-19 pandemic duration due to restrictions on leaving households.
The results have been divided into four sections: Physical Violence, Sexual Violence, Marital Control, and Spousal Violence, with further sub-sections within each area.
Results & Discussion
For all the graphs used in this section, blue denotes NFHS 4 (2015-16), and red indicates NFHS 5 (2019-21).
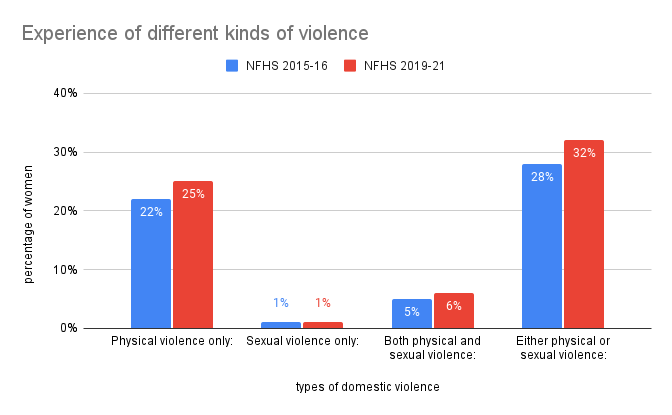
Figure 1: Graphical representation of different kinds of violence experienced by women according to NFHS data 2015-16 and 2019-2021.
In the overall comparison of the experience of different kinds of violence, as seen in in Figure 1, NFHS 4 reported that 22% of women were prey to physical violence only, which has increased to 25% in the 5th edition of the survey. Interestingly, the percentage of victims of sexual violence only remained constant at 1% for both surveys. While 5% of women experienced physical and sexual violence in 2015-16, the data increased to 6% during 2019-21. There was also an augmentation in the data for the experience of either physical or sexual violence, climbing to 32% in NFHS 5 from 28% in NFHS 4. This indicates a concerning rise in the number of females who experience violence. Sexual violence saw no increase over the two surveys, which means the impact of the COVID-19 pandemic was limited to higher physical-aggression tendencies.20 The present study showed an increase in physical aggression during mandatory social isolation, with 56 women reporting physical aggression in 2019 compared to 75 in 2020, an increase of + 32.1%. This result was further supported by the Buss-Perry Aggression Questionnaire (BPAQ), which showed a significant increase in scores for both months of lockdown regarding physical violence.21
Physical Violence
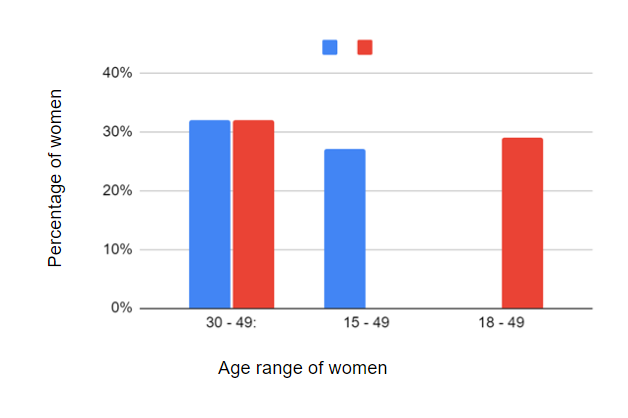
Figure 2: Graphical representation of the experience of physical violence by age, according to NFHS data 2015-16 and 2019-2021.
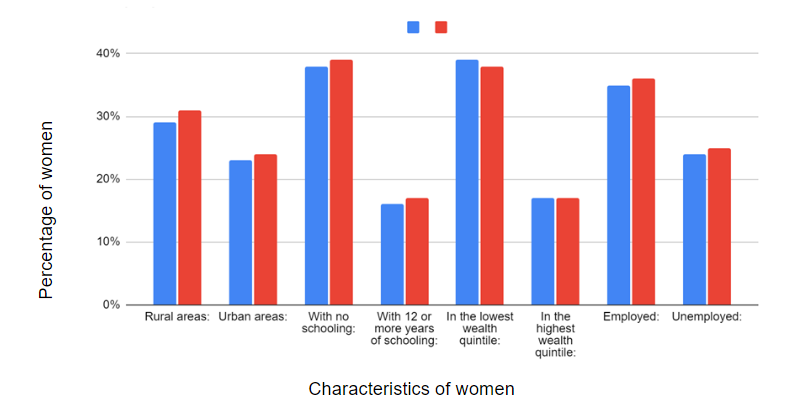
Figure 3: Graphical representation of the experience of physical violence by location, education, wealth, and employment according to NFHS data 2015-16 and 2019-2021.
The experience of physical violence against women saw a trend in location, education, wealth, and women’s employment over the two surveys, as can be seen in Figure 3.
Women in rural areas were more likely to experience violence, a data point which has only increased from 29% in NFHS 4 to 31% in NFHS 5. Violence in urban areas was also found to increase, but not as significant as in rural areas, with a slight increase from 24% to 25% in 2019-21. Supporting this, small rural and isolated areas reported the highest prevalence of violence (22.5% and 17.9%, respectively) compared to 15.5% for urban women.22 Rural women reported significantly higher severity of physical abuse than their urban counterparts.22 The mean distance to the nearest inter-partner violence (IPV) resource was three times greater for rural women than for urban women, and rural IPV programs served more counties and had fewer on-site shelter services.22 Over 25% of women in small rural and isolated areas lived >40 miles from the closest program, compared with <1% of women living in urban areas.22
Uneducated women were more likely to suffer from violence. This could be seen from the statistics, 38% of women with no schooling compared to 16% with 12 or more years of schooling in NFHS 4, and 39% with no schooling as compared to 17% in NFHS 5. Education allows people to understand their rights and empowers them to defend themselves and escape abusive situations.23 The Centre for Women’s Development Studies in New Delhi traced the correlation between education and domestic violence to patriarchal attitudes.23 “Educated women are aware of their rights,” she said. “They are no longer willing to follow commands blindly.”23
The data reported on wealth presented an interesting situation. While it was visible that wealthier women were less likely to be victims of domestic violence, the statistic has not changed over the two surveys (17%). The statistic for less wealthy women who become prey to domestic violence had decreased from 38% in NFHS 4 to 37% in NFHS 5. This indicates an improvement in viewing and considering low wealth in the country. Findings suggest that the relationship between wealth and domestic violence may vary considerably in the included low and middle-income countries. The risk of domestic violence may not necessarily be higher among women in lower wealth brackets.24 Another possibility of the decrease may be due to the loss of wealth during the COVID-19 pandemic. The pandemic has exacerbated global income and wealth inequality, partly reversing the decline of the previous two decades.25
Employed women were more likely to be more prone to domestic violence, 35% in 2015-16 and 36% in 2019-21, than unemployed women, 24% in 2015-16 and 25% in 2019-21. This is an extremely peculiar data point, as across review of literature present, employed women are more empowered to prevent and protect themselves against domestic violence. This disagreement between the normal trend and data collected in the NFHS might have emerged from the patriarchal mindsets where a woman is assigned a “typical” role in the family, restricted to the four walls of their houses and housework, and not allowed to work outside. Thus, when a woman sets out of this role, it tends to go against the male ego. Therefore, women who contributed more financially than their partners had a greater domestic violence risk.26 However, to certifiably conclude that employment is a disadvantage when discussing prevalence of domestic violence will be wrong, and adds to the limitation of the study.
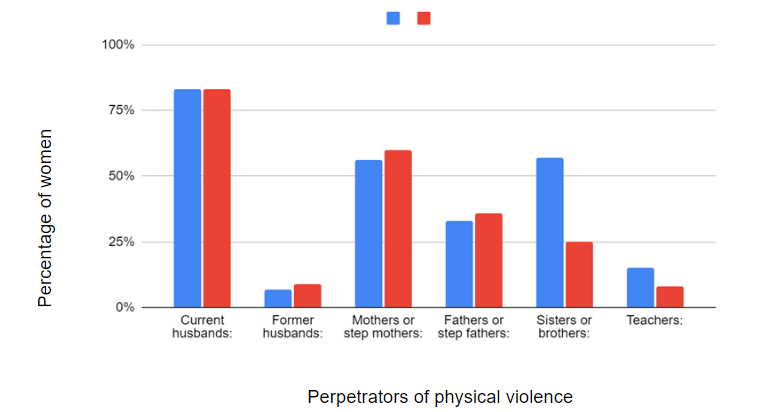
Figure 4: Graphical representation of perpetrators of physical violence according to NFHS data 2015-16 and 2019-2021.
As seen in Figure 4, for every married woman— women who have been married at least once— current husbands and former husbands were categorized as perpetrators. Curiously, the percentage of women who have started their current husband as the perpetrator remained the same for both surveys, 83%, despite the pandemic and its restrictions.
For unmarried women— mothers or stepmothers, fathers or stepfathers, sisters or brothers, and teachers were categorized as perpetrators. An increase from 56% to 60% by mothers or stepmothers, and 33% to 36% by fathers or stepfathers, was observed during the lockdown. This might have been due to the pandemic restrictions that led to spending more time at home. Mothers or stepmothers were more violent than fathers and showed a 4% increase compared to 3% in the case of fathers. On the other hand, the data for sisters or brothers and teachers showed a cataclysmic fall. From 57% in 2015- 16, sisters or brothers as perpetrators had fallen to less than half of that, at 25% in 2019-21. Similarly, teachers as perpetrators almost halved from 15% in 2015-16 to 8% in 2019-21.
Sexual Violence
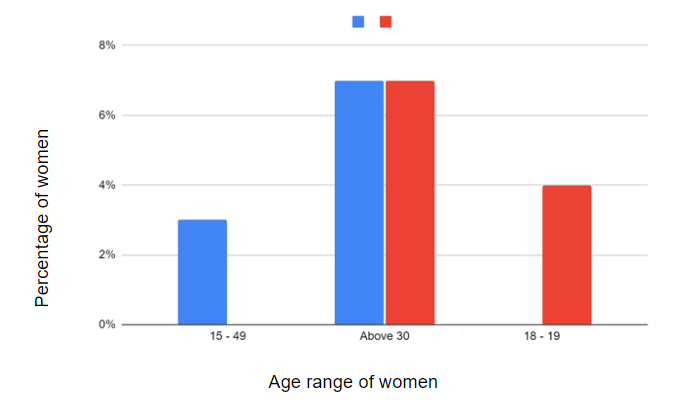
Figure 5: Graphical representation of the experience of sexual violence of age according to NFHS data 2015-16 and 2019-2021.
NFHS 4 and 5 considered the data for age, in terms of the experience of sexual violence, over different age ranges. Figure 5 shows that according to the NFHS 4, 3% of women aged 15-19, 7% aged 30-49, and 9% aged 15-49 had experienced sexual violence. On the other hand, NFHS 5 stated that 4% of women belonging to ages 18-19, 4% of women belonging to ages 20-24, 6% of women belonging to ages 25-29, and 7% of women of ages 30 or more had fallen prey to sexual violence, with 6% of women experiencing it once in their lifetime. The only comparable statistic, of women of ages 30 and above, had remained constant over the two surveys, denoting that there had been no increase or decrease in the sexual violence experience for the women in those ages. However, since 18-19 had a 1% increase in NFHS 5 compared to a more extensive set of 15–19-year-olds in NFHS 4, this indicates that sexual violence is more rampant in the ages of 18 and 19. Furthermore, the trend in the case of age, for both the surveys, showed an increase in the percentage of women experiencing sexual violence with an increase in their generation.
A detailed study of trial court cases from January 2013 to September 2015 in Delhi State undertaken by the Centre for Child and the Law, National Law School of India University (NLSIU), Bangalore, recorded 526 complaints of sexual assault under POCSO.27 Twenty-eight 28% of these (186 complaints) concerned adolescents between the ages of 16 and 18.27 Data used from ‘Crime in India,’ an annual publication of the National Crime Record Bureau of India, finds that the share of rape of elderly women as a percentage of the total number of rape incidents has increased in the past years, especially since 2014-16.28 It mentions that in 2015, 66% of reported sexual violence cases belonged to the age group of 18 to 50, as compared to 32% of cases for below 18 years of age, clearly showing the augmentation in the statistic with age.28 The study concludes by stating that the findings indicate an exponential increase in the incidence of rape and sexual violence against elderly women, both in absolute numbers and as a share of the total number of incidents of rape against women.28 Furthermore, the impact of the pandemic on the cases of sexual violence clearly shows that they have increased. Since the pandemic, an increased statistic of 6 in 10 women said that sexual harassment in public has worsened.29
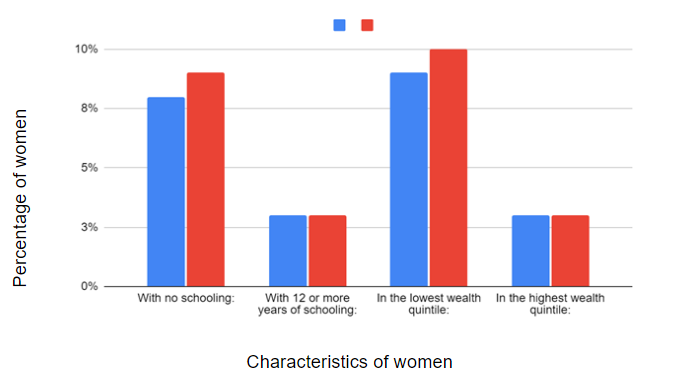
Figure 6: Graphical representation of the experience of sexual violence by education and wealth according to NFHS data 2015-16 and 2019-2021.
Data gathered in 2015-16 from NFHS 4, illustrated in Figure 6, reported that approximately 8% of females with no schooling experienced sexual violence compared to 3% with 12 or more years of schooling. With a similar trend of sexual violence being more prevalent for uneducated females, data gathered in NFHS 2019-21 indicated that 9% of women without schooling fell prey, compared to 3% with 12 or more years of education. The statistic of educated victims of sexual violence had remained the same over both surveys, whereas there had been a 1% increase in the statistics for uneducated victims.
A cross-sectional study on the association between women’s level of education and their experience of intimate partner violence (IPV) also concluded that women with higher education have a lower risk of physical and sexual IPV.30 Further, in some aspects of the violence, women’s level of education has a protective effect.30 Additionally, less educated women reported more violence, which was statistically significant.31
Regarding wealth, 9% of women in the lowest and 3% of women in the highest had faced sexual violence in NFHS 2015-16. In NFHS 5, 10% of women in the lowest wealth quartile faced sexual violence, along with the constant data of 3% of women in the highest wealth quartile. This establishes that women in the lowest wealth quartile are almost three times more likely to face violence, and the percentage had increased by 1% over the two surveys. A study of 21 cases of sexual assault, out of which 61.9% belong to rural backgrounds, concluded that young girls from poor settlements and lower social strata should especially receive special attention regarding sexual violence.32 Furthermore, violence during the pandemic stated that 66% of women living in rural areas were also more likely to think that sexual harassment in public spaces has worsened, compared to 55% of women living in urban areas.29 And since, in India, the poverty ratio is 32.75% in rural areas against 8.81% in urban areas, the prevalence of sexual violence for unwealthy women has augmented, especially during the pandemic.33 Globally, violence against women disproportionately affects low- and lower-middle-income countries and regions.34 37% of women aged 15 to 49 living in countries classified by the Sustainable Development Goals as “least developed” have been subject to physical and sexual intimate partner violence in their life.36 22 % of women in “least developed countries have been subjected to IPV in the past 12 months—substantially higher than the world average of 13%.36
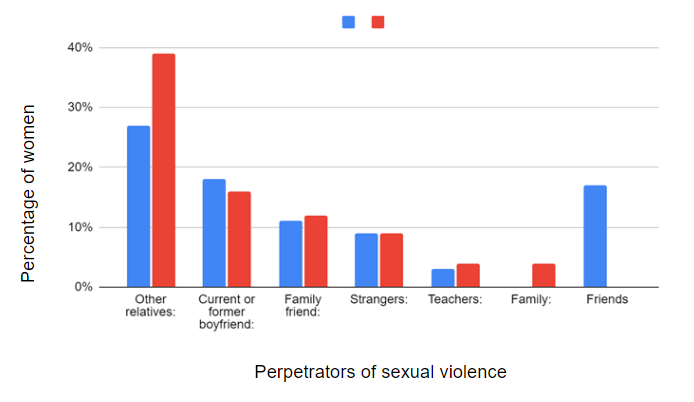
Figure 7: Graphical representation of perpetrators of sexual violence for never-married women according to NFHS data 2015-16 and 2019-2021.
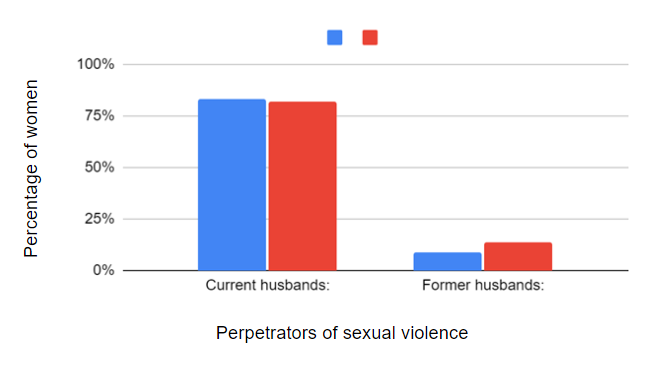
Figure 8: Graphical representation of perpetrators of sexual violence for ever-married women according to NFHS data 2015-16 and 2019-2021.
Figure 8 portrays that the most common perpetrators of sexual violence for married women were their current husbands- 83% in NFHS 4 and a reduction of just 1% in NFHS 5. An increased statistic of 14% of the former husbands as perpetrators emerged in NFHS 5, compared to 9% in NFHS 4, which is unlikely and needs further speculation. Of those in a relationship, almost one in four adolescent girls aged 15–19 (24%) have experienced physical and sexual violence from an intimate partner or husband.5 16% of young women aged 15 to 24 experienced this violence in the past 12 months.5 Globally, 81,000 women and girls were killed in 2020, and around 47,000 of them (58%) died at the hands of an intimate partner or a family member.35
For unmarried women, as seen in Figure 7, other relatives were the most common perpetrator, at 27% in NFHS 4 and 39% in NFHS 5, followed by a current or former boyfriend, which reduced to 16% in NFHS 5 from 18% in NFHS 4, a family friend at 11% in NFHS 4 and 12% in NFHS 5, 9% of strangers over both the surveys, 3% teachers in NFHS 4 and 4% in NFHS 5, 4% for a family in NFHS 5 (not accounted in NFHS 4) and 17% for friends in NFHS 4 (not accounted for NFHS 5). Globally, 6 % of women report they have been subjected to sexual violence from someone other than their husband or partner.36 These statistics for never-married women can be highly influenced by the pandemic. The data for relatives has increased, and family friends and family has grown— all possible due to residence restrictions during the lockdown. Similarly, data for boyfriends and friends has decreased or been disregarded due to its low prevalence, as public meetings were restricted during the pandemic. Interestingly, the data for teachers as perpetrators have increased, even though most schools were online or closed due to COVID-19 and the lockdown.
Marital Control
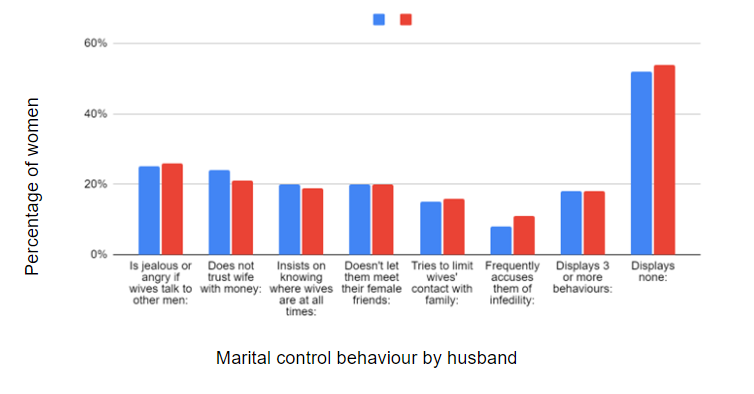
Figure 9: Graphical representation of the experience of marital control by actions according to NFHS data 2015-16 and 2019-2021.
The NFHS survey data also encompasses marital control data, including attempts by husbands to control and monitor their wives’ lives and behavior closely; the same is portrayed graphically in Figure 9. If looked at through the lens of actions perpetrated by the husbands, 26% of women reported that their husbands get jealous if they talk to other men in NFHS 5, a 1% increase from the 25% of women in NFHS 4. Additionally, a 3% higher number of 11% of women were frequently accused of infidelity in 2019-21 compared to 2015-16. Jealousy, or the fear of infidelity, in addition to exacerbating relationship conflicts and tension, is described to lead directly to physical inter-partner violence.37 This was often described as a trigger for men, though rarely women, to use violence against their partners in response to actual or suspected infidelity.37
The data point for “insists on knowing where wives are at all times” has also fallen by 1% in NFHS 5, compared to the 19% in NFHS 4. Similarly, this could also be related to the restrictions brought upon by the pandemic, strictly limiting any travel outside the home. 20% of women were not allowed to meet their friends in both surveys. This shows that irrespective of legal restrictions, females are prohibited from meeting their friends. In addition, 16% of women were limited in their contact with their family in 2019-21, another 1% augmentation from the 2015-16 data.
The percentage of women who reported that their husbands displayed three or more controlling behaviors remained constant at 20%. However, the percentage of women who reported that their husbands demonstrated none of the behaviors increased to 54% in NFHS 5 from 52% in NFHS 4. This shows that the number of males that are less controlling has increased. However, the controlling population has remained constant.
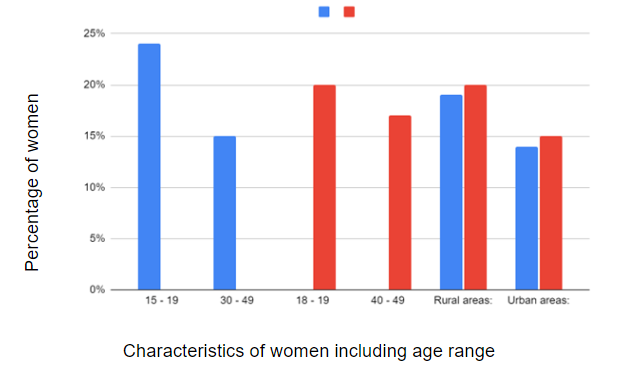
Figure 10: Graphical representation of the experience of marital control by age and location to NFHS data 2015-16 and 2019-2021.
Since the age samples for both surveys are different, they cannot be compared. However, in Figure 10, the percentage of women experiencing marital control during ages 18-19 and 40-49 was 20% and 17%, respectively, in 2019-21, as compared to 24% and 15% in 2015-16; this portrays how older women are more prone to marital control. Suppose the smaller sample sizes carry a large amount of data. In that case, it means that the happenings are concentrated during that period, thus indicating how out of a larger sample, a smaller range is more susceptible— the elder bracket. Such marital control in old age is also related to domestic violence. Furthermore, the data for rural and urban women showed that spousal control is more prominent in rural areas, increased by 1% from 2015-16 to 2019-21— 19% to 20% for rural women and 14% to 15% for urban women. This highlights an apparent increase in the rise of number of women that experience marital control, regardless of their location. Domestic violence and spousal control were not associated with the tested outcomes among urban women, but they were with rural women.38 Patriarchal views of the family, including traditional roles about gender relations and gender inequality, are commonly held in rural communities.39,40 These factors may affect a woman’s ability to speak out about abuse, reinforcing the message that what happens between a husband and wife is a private matter.41 This social structure perpetuates violence as a means of social control.39
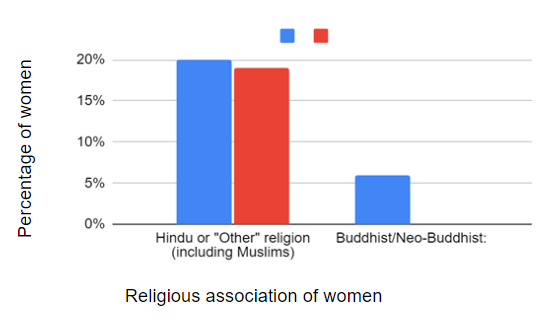
Figure 11: Graphical representation of the experience of marital control by religion according to NFHS data 2015-16 and 2019-2021.
Surprisingly, the NFHS survey data considers only three religions when determining the categories, especially in religiously vibrant demographics like the Indian subcontinent, as seen in Figure 11. Hindus and Muslims make up most of the Indian population; Hindus make up 79.8% of India’s population, and Muslims account for 14.2%. Therefore, since the probability of women taking the survey being Hindu/Muslim is higher, their reported cases might be high too. In NFHS 4, 20% of such women reported experiencing marital control, which decreased to 19% in NFHS 5.
As for Buddhism, Buddhist beliefs and gender roles within the Buddhist community perpetuate or silence the issue of violence against women (VAW) and how these beliefs can be used to break the cycle of gender violence.42 Buddhism’s core values are important in that they may be used to heal and empower survivors of VAW rather than perpetuate violence.43 Thus, it is possible that women of the Buddhist community are more aware, and so step forward as victims. 6% Neo-Buddhist/Buddhist females reported having dealt with marital control, a statistic not collected in 2019-21.
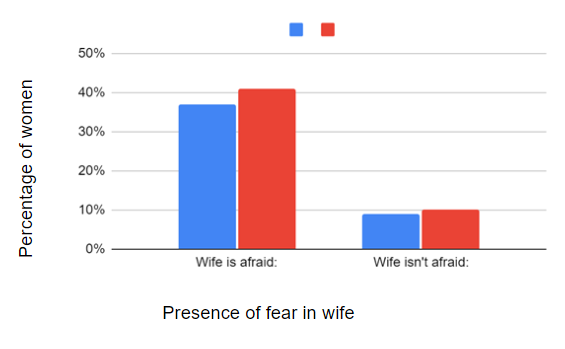
Figure 12: Graphical representation of the experience of marital control by the wife’s fear according to NFHS data 2015-16 and 2019-2021.
Data collected shows that marital control is more prevalent if the wife is afraid of the husband, the percentage for which has also increased over the years; this is portrayed through Figure 12. As per NFHS 4, 37% of women reported being fearful of their husbands as a part of marital control, whereas 9% of women did not. In 2019-2021, a significant increase occurred in the percentage of women who were afraid of their husbands, 41%, whereas only a 1% increase was observed in the number of women who said they were not scared of their husbands. This shows that the prevalence of marital control has increased over the two surveys and that more women were afraid of their husbands in NFHS 5.
Spousal Violence
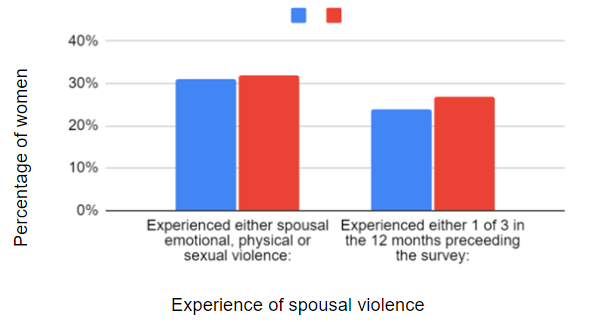
Figure 13: Graphical representation of the experience of spousal violence according to NFHS data 2015-16 and 2019-2021.
Data on spousal violence indicates augmentation between NFHS 4 and 5, as seen in Figure 13. An increase of 1% of women who experienced either spousal sexual, emotional, or physical violence in 2019-21 compared to 31% in 2015-16. Furthermore, 27% of women experienced it in the 12 months preceding the survey in NFHS 5, and it increased from 24% in 2015-16.
The findings of a rapid 8-day online survey on spousal violence against women during the COVID-19 lockdown in India support this analysis.44 Of the 101 positive responses, the rates of physical, sexual, verbal, and emotional violence were 34.7%, 10.9%, 65.3%, and 43.6%, respectively.44 While 13.6% (n= 76) reported spousal violence experienced before the lockdown, 4.5% (n = 25) said it to have begun since the lockdown.44 This indicates a 33.1% increase in the rates since the lockdown.44 Of those who reported spousal violence to be present before the lockdown, 77.6% (n = 59) reported increased violence since the lockdown was enforced.44 The study concluded that the responses they received reflected an increase in spousal violence since the COVID-19 lockdown in India.44
Slapping was the most common form of spousal physical violence (25%), followed by pushing, shaking, and having something thrown at you (12%). This more than 10% difference between the two most common forms portrays slapping as a rapidly occurring and widespread action. Arm twisting or hair pulling closely follow (10%), with punching and beating (8%) and finally choking or burning being the least common (2%). The gap of 6% between the least two common forms portrays the extremely rare prevalence of choking or burning— meaning when it is exercised, the situation is dire. However, the interesting detail is that none of the actions has seen a percentage increase over the two surveys. This indicates that the trends of physical abuse have remained the same, despite the lockdown. Almost 50% of women out of a sample of 500 in Maharashtra reported being slapped at a point in their marriage, the most common prevalence of physical violence in the model.45 This evidences the high prevalence of slapping as part of spousal physical violence, which hasn’t changed during the lockdown.
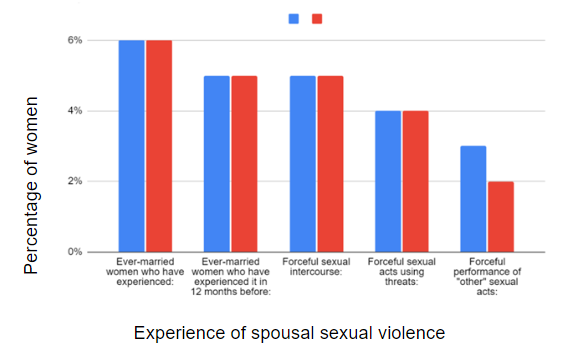
Figure 14: Graphical representation of the experience of spousal sexual violence according to NFHS data 2015-16 and 2019-2021.
Figure 14 shows that data collected on spousal sexual violence indicate either no change or decrease over the period of NFHS 4 and NFHS 5. 6% of ever-married women had experienced spousal sexual violence, and 5% had experienced it in the 12 months preceding the survey over the course of both surveys. Although this shows no increase in spousal sexual violence due to the lockdown, it does mean that occurrences of sexual violence are more rampant, as out of the 6% who had ever experienced it, 83% of them experienced it in the 12 months preceding the survey.
Forced sexual intercourse was the most common method of spousal sexual violence, at 5%. Experiences of forced sexual relations, often perpetrated by an intimate partner, have been increasingly documented over the last decade. An analysis of over fifty population-based surveys revealed, for example, that between 10 and 50% of adult women globally reported having been physically assaulted by an intimate male partner, including husbands, at some point in their lives and in more than one-third of these cases sexual abuse was also experienced.46 A recent review of non-consensual sexual experiences of young people, primarily those aged thirteen to twenty-four, also suggests that between 2 and 20% of adolescent and young women have experienced non-consensual sexual relations.47 Although significant proportions of sexually active adolescents and young women (fifteen to twenty-four-year-olds) in developing-country settings are married, the literature is surprisingly silent on the sexual experiences of these young women and the extent to which these experiences are wanted or consensual.47 Evidence on forced sexual experiences within marriage among adolescents and young women in India comes mainly from qualitative studies.47 Quantitative data are also available from three small-scale surveys that highlight the prevalence of such experiences. These surveys, conducted in the states of Gujarat and West Bengal, observe that between 6 and 13% of young married women reported forced sexual experiences perpetrated by their husbands.48,49
Interestingly, percentage data for “forced sexual performance of ‘other’ acts” saw a fall of 1%, from 3% in NFHS 4 to 2% in NFHS 5, meaning that over the course of the lockdown, forceful performances of such acts were reduced. Although there is no certified reasoning as to why this has decreased, a changed age sample may play a role. If that is the case, then it would imply that women between the age of 15 and 18 years old are more likely to be forced to perform ‘other’ sexual acts, as compared to women above 18 years of age. Furthermore, this may also indicate how the development of the human mind and maturity of the body can influence a woman’s experience of domestic spousal violence.
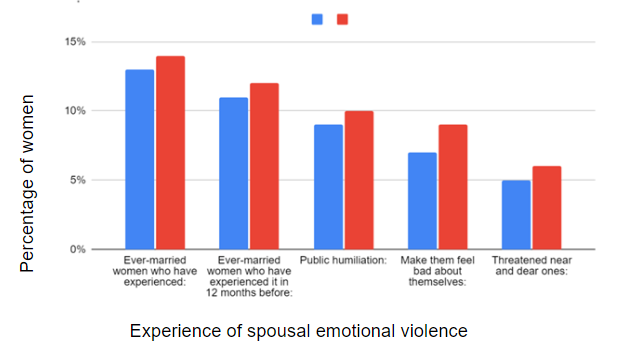
Figure 15: Graphical representation of the experience of spousal emotional violence according to NFHS data 2015-16 and 2019-2021.
Data collected on spousal emotional violence had increased over the period of NFHS 4 and 5, as seen in Figure 15. For example, ever-married women who experienced it in NFHS 4 were 13%, which increased to 14% in NFHS 5. Similarly, ever-married women who experienced it in the 12 months preceding the survey in NFHS 4 was 11%, which increased to 12% in NFHS 5. This indicates that spousal emotional violence increased during the lockdown but also saw more rampant incidences, as 85% occurred in the recent past.
A cross-sectional study conducted in June–August 2020 on married Indian women of reproductive age who attended the obstetrics-gynaecology outpatient department during the COVID-19 pandemic using The Abuse Assessment Screening questionnaire had 412 women included in the study.16 The prevalence of domestic violence in any form was 32.5%, with one of the majority being public humiliation.16 Furthermore, the percentage of making wives feel bad about themselves was the highest, from 7% in NFHS 4 to 9% in NFHS 5. This means that feelings of superiority, disrespect, and ego were heightened in husbands during the lockdown. Lastly, threatening near and dear ones also increased to 6% in NFHS 5 from 5% in NFHS 4.
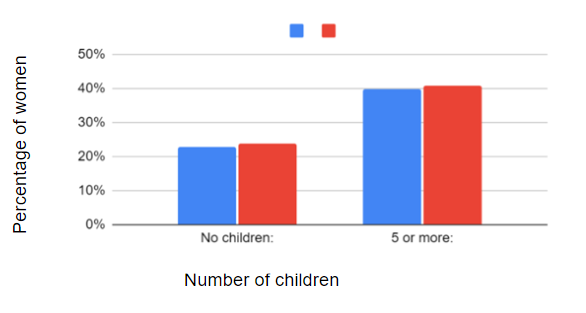
Figure 16: Graphical representation of several children’s experience of spousal violence according to NFHS data 2015-16 and 2019-2021.
Women with five or more children are almost twice as likely to experience spousal violence as women without children, as seen in Figure 16. These data points saw an increase over the two surveys. In NFHS 4, 23% of women with no children faced spousal violence, and 40% of women with five or more children. In NFHS 5, increased figures of 24% and 41% were observed. However, literature on the link between the number of children and violence experienced by women is lacking in context to the Indian scenario, so no conclusion could be drawn from this data.51
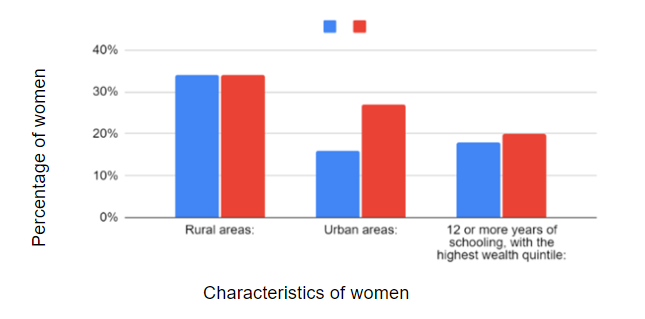
Figure 17: Graphical representation of the experience of spousal violence by education, wealth, and education according to NFHS data 2015-16 and 2019-2021.
Figure 17 portrays that spousal violence is more prevalent in uneducated women who reside in rural areas, the percentage of which remained constant for both surveys (34%). A community-based cross-sectional study was carried out in a rural area of Puducherry, South India.50 Married women in the reproductive age group were interviewed using a structured pretested questionnaire.50 Of 310 study participants, 56.7% reported some form of domestic violence, 51.3% said psychological violence, 40% reported physical violence, and 13.5% reported sexual violence.50 A statistically significant association was found between women’s illiteracy and domestic violence (AOR: 4.3, 95% confidence interval: 1.1–15.7 P: 0.03).50 The prevalence of domestic violence was found to be high in this rural setting.50
However, data about the experience of spousal violence in urban areas saw a significant increase during the lockdown, from 16% in NFHS 4 to 27% in NFHS 5. This evidence can be seen in heightened statistics from major Indian metropolitan cities. For example, data showed that domestic violence complaints doubled after the nationwide lockdown was imposed in India.52 Tamil Nadu Police reported an increase in domestic violence complaints. They received approximately 25 calls daily during the lockdown period and registered at least 40 such cases.53 Similarly, Bangalore Police reported a spike in complaints from 10 calls to 25 calls every day from the victims of domestic violence.54 These data from different sources indicate domestic violence incidents increased nationwide during the lockdown.
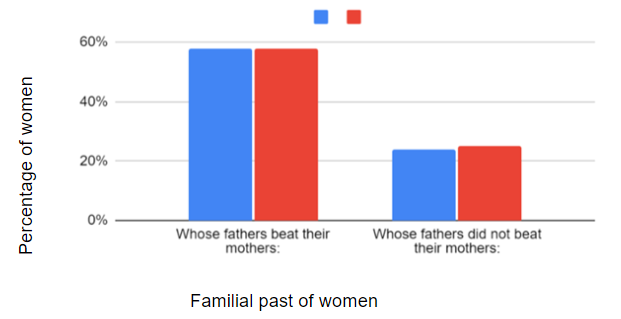
Figure 18: Graphical representation of the experience of spousal violence by intergenerational effects according to NFHS data 2015-16 and 2019-2021.
Women whose fathers beat their mothers were more likely to experience spousal violence, 58% of which was consistent throughout both surveys, as is visible through Figure 18. Childhood exposure to parental and spousal violence plays a vital role in shaping conformation to the gender role norms in India.55 Moreover, the findings suggest that exposure to childhood violence has a more devastating effect on building women’s understanding of gender norms.55 Also, there is high concordance in the recent experience of spousal violence against women and spousal violence faced by their mothers.55 The risk of a lifetime and past-year physical and sexual violence was significantly higher for those who had witnessed interparental violence during childhood than those with no such experience.56 Women with experience of interparental violence during childhood reported acceptance of violence within an intimate relationship to a greater extent than those without such experience.56 This indicates that intergenerational effects have a strong influence over spousal violence.
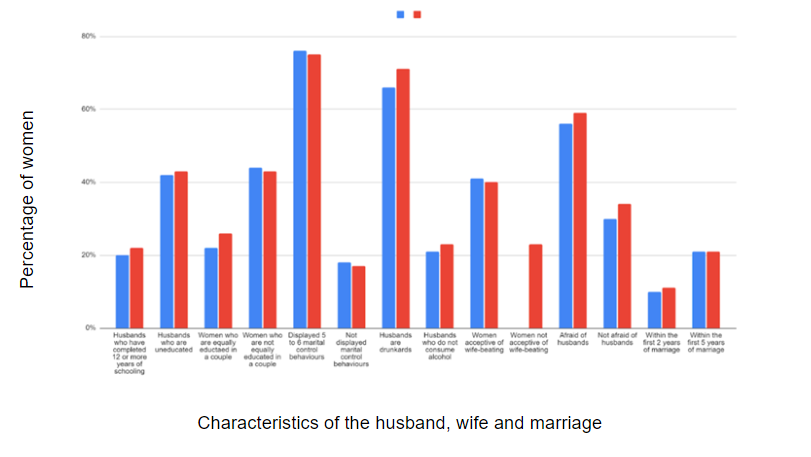
Figure 19: Graphical representation of the experience of spousal violence by the characteristics of husband, wife, and the marriage according to NFHS data 2015-16 and 2019- 2021.
As is shown through Figure 19, literacy and levels of education attained by men also have a significant impact on reducing the incidence of domestic violence.57 Spousal violence was almost twice more prevalent when the husband is not educated (42% in NFHS 4, 43% in NFHS 5) than when husbands have completed 12 or more years of schooling (20% in NFHS 4, 22% in NFHS 5). Their study concludes that husbands with higher levels of education are less likely to engage in violence.57
Furthermore, evidence from other countries indicates a lower incidence of domestic abuse in couples where the woman is more educated than the husband or partner compared to equally low-educated spouses.57 This supports the findings from NFHS 4 and 5, where women who are equally educated in a couple were less likely to suffer spousal violence (22% in NFHS 4 and 26% in NFHS 5) as compared to women who are not equally educated (44% in NFHS 4 and 43% in NFHS 5). While the statistic for equally educated women who suffer spousal violence had risen during the lockdown, the statistic for unequally educated women who suffer spousal violence had decreased. This indicates how restrictions due to the COVID-19 pandemic have negatively impacted literate females in terms of the violence faced and positively impacted illiterate females.
Data on the relationship between marital control behaviors and spousal violence decreased over the two surveys. For example, couples where the husband displayed five or more marital control methods, were more likely to suffer spousal violence, 76% in NFHS 4 to 75% in NFHS 5, as compared to couples where the husband did not display any marital control behavior, 18% in NFHS 4 to 17% in NFHS 5.
Data reflects that husbands with a drinking addiction were more likely to propel spousal violence, an increased statistic of 71% in 2019-21 from 66% in 2015-16, as compared to husbands that do not drink, which also saw an increase from 21% in 2015-15 to 23% in 2019-21. Although there are mixed findings concerning changes in the quantity of drinking, there are reports of binge/heavy drinking during the lockdown and relapse post-lockdown.58 Furthermore, positive, zero-order correlations were found between antisocial behavior, long-term alcohol involvement, family conflict, and husbands’ reports of violent behavior toward their wives.58 A history of alcohol-related troubles was associated with a hostile family environment and increased violence in the home.59
In NFHS 4, 41% of women acceptive wife-beating suffered spousal violence. Data for women not acceptive of wife-beating was not recorded then. This is a research gap. In NFHS 5, 40% of women acceptive of wife-beating suffered spousal violence, 1% lesser than last year. 23% of women not acceptive of wife-beating suffered spousal violence in 2019-21. This shows that women accepting of beating are more likely to suffer spousal violence. This statistic has seen a reduction, and this can be because more women are now becoming self-aware of their rights and are standing up against violence.
Conclusion
A pattern has emerged from the findings of the two surveys on the parameters that make women more prone to experiencing domestic violence. Aged, married, uneducated, employed, poor, and rural women are more prone to violence. However, how the lockdown has impacted the severity of these factors differs for each. While most categories saw an increase during the pandemic years, some, especially those that included literacy aspects, saw a fall. This implies that while overall, the pandemic caused a rise in violence, it led to improvements in categories due to situational problems such as mass unemployment, financial stress, and fear of disease also impacting the psyche. Different factors were found to play a role; hence, there is a need for social revolution for this public health concern.
Limitations
This paper has some potential limitations. Firstly, the data analysis is primarily based on secondary data collected from a restricted sample. This may lead to problems in generalization due to the extensive nature of the Indian population and also because many study victims reside in rural areas that are remote and unreachable. Secondly, the data gathered is spread over a large span of years and does not consider other changes that might have occurred over the two surveys, such as economic and demographic changes. Similarly, the paper’s analysis is primarily based on the assumption that the lockdown restrictions led to an increase in the statistics. However, there is no primary data evidence of the same. Lastly, limitations in the analysis also arose from gaps in the available research knowledge.
This includes that change in sample size over the two surveys, making it impossible for data to be compared and analyzed at par. NFHS 4 considered women from age 15 onwards; NFHS changed that to age 18, completely disregarding three years of probable violence. While there has been no mention of an apparent reason, the legal age of marriage might play a role. For example, NFHS 4 stated that 27% of women aged 20- 24 got married before the legal age of 18. However, this had decreased to 23% in NFHS 5. Therefore, the sample could have changed since more women were getting married at 18. This is also indicated in the fact that 16% of women had experienced violence in both 15-19 and 18-19. Since 18-19 is a more concentrated sample, this would mean that similar statistics data shows more rampant violence for that age group.
The lack of data on non-spousal emotional violence also makes it unable to compare married and unmarried individuals, or establish a relationship, if any, between marriage and the occurrence of emotional violence. Additionally, a minimal scope of religious categorization has been presented by NFHS, despite the immensely varied religious population of the Indian subcontinent. This also makes it challenging to analyze the link between religion and violence and research the causes and consequences of different faiths for the same.
Implications
The paper brings to light various gaps in the NFHS data like the difference in age groups, making it difficult to compare data across years, and increasing religious variety that would be critical in helping to understand the implication of religion on the occurrence of domestic violence, and also data on non- spousal emotional violence, which may help bring to light a large sample of women being neglected. Furthermore, the stagnant or increasing data points call for greater government programs to manage and control domestic violence. Therefore, the paper may help in policy creation.
Acknowledgements
My gratitude remains with my research team for guiding me every step of the way and making this paper truly a pleasure to work on, as well as my parents, who have remained as supportive and motivating throughout this process, as they have been for everything I have done in my life.
Author
Jassimmrat is 16, and a passionate spokesperson for gender equality. She is finishing her sophomore year in high school. As someone with a creative bend of mind, Jassimmrat wishes to explore Literature, History or PPE as an international student. She enjoys writing and reading outside of school, and is dabbling in photography and filmmaking.
References (sources cited)
- United Nations. What Is Domestic Abuse? UNITED NATIONS. https://www.un.org/en/coronavirus/what-is-domestic-abuse.
- Kaur, R.; Garg, S. Addressing Domestic Violence against Women: An Unfinished Agenda. Indian Journal of Community Medicine 2008, 33 (2), 73. https://doi.org/10.4103/0970-0218.40871.
- World Health Organization. Violence against women. www.who.int. https://www.who.int/news- room/fact-sheets/detail/violence-against-women#:~:text=Estimates%20published%20by%20WHO%20indicate.
- Fader, S. A History Of Domestic Violence: How Much Have Things Changed? | Betterhelp. www.betterhelp.com. https://www.betterhelp.com/advice/domestic-violence/a-history-of- domestic-violence-how-much-have-things-changed/.
- UN Women. Facts and figures: Ending violence against women. UN Women. https://www.unwomen.org/en/what-we-do/ending-violence-against-women/facts-and-figures.
- UN Women. What we do: Ending violence against women. UN Women. https://www.unwomen.org/en/what-we-do/ending-violence-against-women
- Nations, U. International Day for the Elimination of Violence against Women. United Nations. https://www.un.org/en/observances/ending-violence-against-women-day.
- THE PROTECTION of WOMEN from DOMESTIC VIOLENCE ACT, 2005. https://www.indiacode.nic.in/bitstream/123456789/15436/1/protection_of_women_fro m_domestic_violence_act%2C_2005.pdf.
- A Summary Report of a Multi-Site Household Survey Domestic Violence in India; 2000. https://www.icrw.org/wp-content/uploads/2016/10/Domestic-Violence-in-India-3-A-Summary- Report-of-a-Multi-Site-Household-Survey.pdf.
- UNICEF. Gender equality. www.unicef.org. https://www.unicef.org/india/what-we- do/gender-equality.
- 1 in 3 women in India is likely to have been subjected to intimate partner violence | BMJ. BMJ. https://www.bmj.com/company/newsroom/1-in-3-women-in-india-is-likely-to-have-been- subjected-to-intimate-partner-violence/.
- Violence against women in India and the remedies as per the Indian Constitution – A Critical Analysis. legalserviceindia.com. https://www.legalserviceindia.com/legal/article-4208- violence-against-women-in-india-and-the-remedies-as-per-the-indian-constitution-a-critical- analysis.html
- English Releases. pib.gov.in. https://pib.gov.in/newsite/erelcontent.aspx?relid=35773#:~:text=Article%2042%20directs%20t he%20State (accessed 2023-04-14).
- Sharma, I. Violence against Women: Where Are the Solutions? Indian Journal of Psychiatry 2015, 57 (2), 131. https://doi.org/10.4103/0019-5545.158133.
- रा#$kय अपराध *रकॉड. /यूरो. ncrb.gov.in. https://ncrb.gov.in/sites/default/files/CII%202019%20Volume%201.pdf.
- Kamath, A.; Yadav, A.; Baghel, J.; Mundle, S. Locked Down: Experiences of Domestic Violence in Central India. Global Health: Science and Practice 2022, 10 (4), e2100630. https://doi.org/10.9745/ghsp-d-21-00630.
- Gulati, G.; Kelly, B. D. Domestic Violence against Women and the COVID-19 Pandemic: What Is the Role of Psychiatry? International Journal of Law and Psychiatry 2020, 71, 101594. https://doi.org/10.1016/j.ijlp.2020.101594.
- Thompson, R. S.; Bonomi, A. E.; Anderson, M.; Reid, R. J.; Dimer, J. A.; Carrell, D.; Rivara, F. P. Intimate Partner Violence. American Journal of Preventive Medicine 2006, 30 (6), 447– 457. https://doi.org/10.1016/j.amepre.2006.01.016
- National Family Health Survey. Rchiips.org. http://rchiips.org/nfhs/.
- Araujo, S. C. S.; de Souza, A. A. B.; Coelho, L. V.; Ramos, G. V.; Silveira, R. L.; Amaral, M.B. F. Did Physical Aggression in Women Increase during the Novel Coronavirus 2019 (COVID-19) Pandemic? A Perspective of Facial Trauma. Oral and Maxillofacial Surgery 2022. https://doi.org/10.1007/s10006-022-01118-2.
- Killgore, W. D. S.; Cloonan, S. A.; Taylor, E. C.; Anlap, I.; Dailey, N. S. Increasing Aggression during the COVID-19 Lockdowns. Journal of Affective Disorders Reports 2021, 5, 100163. https://doi.org/10.1016/j.jadr.2021.100163.
- Peek-Asa, C.; Wallis, A.; Harland, K.; Beyer, K.; Dickey, P.; Saftlas, A. Rural Disparity in Domestic Violence Prevalence and Access to Resources. Journal of Women’s Health 2011, 20 (11), 1743–1749. https://doi.org/10.1089/jwh.2011.2891.
- Development of Women through Education against Domestic Violence. International Journal of Education and Information Studies 2011, 1 (1), 1–5.
- Kebede, S.; Van Harmelen, A.-L.; Roman-Urrestarazu, A. Wealth Inequality and Intimate Partner Violence: An Individual and Ecological Level Analysis across 20 Countries. Journal of Interpersonal Violence 2021, 088626052110163. https://doi.org/10.1177/08862605211016337.
- Adarov, A. Global income inequality and the COVID-19 pandemic in three charts. blogs.worldbank.org. https://blogs.worldbank.org/developmenttalk/global-income-inequality- and-covid-19-pandemic-three-charts.
- Abramsky, T.; Lees, S.; Stöckl, H.; Harvey, S.; Kapinga, I.; Ranganathan, M.; Mshana, G.; Kapiga, S. Women’s Income and Risk of Intimate Partner Violence: Secondary Findings from the MAISHA Cluster Randomised Trial in North-Western Tanzania. BMC Public Health 2019, 19 (1). https://doi.org/10.1186/s12889-019-7454-1.
- Pitre, A.; Lingam, L. Age of Consent: Challenges and Contradictions of Sexual Violence Laws in India. Sexual and Reproductive Health Matters 2021, 29 (2), 1–19. https://doi.org/10.1080/26410397.2021.1878656.
- Singh, T. Geriatric Sexual Violence in India: Studying State- Wise and Year-Wise Trends. http://maitreyi.ac.in/Datafiles/cms/2020/magzine/issue%202020-1/geriatric.pdf (accessed 2023-04-14).
- VIOLENCE against WOMEN during COVID 19 MEASURING the SHADOW PANDEMIC: 2. https://data.unwomen.org/sites/default/files/documents/Publications/Measuring-shadow- pandemic.pdf.
- Loembe, D. Association between Women’s Level of Education and Their Experience of Intimate Partner Violence in Nigeria a Cross-Sectional Study. https://www.diva- portal.org/smash/get/diva2:1472860/FULLTEXT01.pdf.
- Shetty, S.; Kundapur, R.; Kempaller, V.; Kumar, A.; Anurupa, M. Violence against Educated Women by Intimate Partners in Urban Karnataka, India. Indian Journal of Community Medicine 2017, 42 (3), 147. https://doi.org/10.4103/ijcm.ijcm_41_16.
- Aggarwal, A. D.; Singh, P.; Walia, D. S.; Kukreja, S. Study of Sexual Assault Cases among below 18 Years Age Group during September 2018 to September 2020 in Government Medical College, Patiala, Punjab, India: Cross-Sectional Study. Pan African Medical Journal 2022, 41. https://doi.org/10.11604/pamj.2022.41.15.29852.
- Dhasmana, I. Poverty Ratio 32.75% in Rural Areas against 8.81% in Urban: NITI Report. Business Standard India. December 5, 2021. https://www.business- standard.com/article/economy-policy/poverty-ratio-32-75-in-rural-areas-against-8-81-in-urban- niti-report-121120500971_1.html.
- UN Women. Facts & Figures. UN Women. https://www.unwomen.org/en/news/in- focus/commission-on-the-status-of-women-2012/facts-and-figures
- UNODC Research: 2020 saw a woman or girl being killed by someone in their family every 11 minutes. United Nations: Office on Drugs and Crime. https://www.unodc.org/unodc/frontpage/2021/November/unodc-research_-2020-saw- every-11-minutes-a-woman-or-girl-being-killed-by-someone-in-their-family.html.
- World Health Organization. Devastatingly pervasive: 1 in 3 Women Globally Experience Violence. www.who.int. https://www.who.int/news/item/09-03-2021- devastatingly-pervasive-1-in-3-women-globally-experience-violence.
- Kyegombe, N.; Stern, E.; Buller, A. M. “We Saw That Jealousy Can Also Bring Violence”: A Qualitative Exploration of the Intersections between Jealousy, Infidelity and Intimate Partner Violence in Rwanda and Uganda. Social Science & Medicine 2021, 114593. https://doi.org/10.1016/j.socscimed.2021.114593.
- Meiksin, R.; Meekers, D.; Thompson, S.; Hagopian, A.; Mercer, M. A. Domestic Violence, Marital Control, and Family Planning, Maternal, and Birth Outcomes in Timor-Leste. Maternal and Child Health Journal 2014, 19 (6), 1338–1347. https://doi.org/10.1007/s10995-014-1638- 1.
- Gagné, P. L. Appalachian Women: Violence and Social Control. J. Contemp. Ethnogr. 1992, 20 (4), 387–415. https://doi.org/10.1177/089124192020004001.
- Websdale, N. Rural Women Battering and the Justice System: An Ethnography; SAGE, 1998.
- Riddell, T.; Ford-Gilboe, M.; Leipert, B. Strategies Used by Rural Women to Stop, Avoid, or Escape from Intimate Partner Violence. Health Care for Women International 2008, 30 (1-2), 134–159. https://doi.org/10.1080/07399330802523774.
- Eisenbruch, M. The Cultural Epigenesis of Gender-Based Violence in Cambodia: Local and Buddhist Perspectives. Culture, Medicine, and Psychiatry 2018, 42 (2), 315–349. https://doi.org/10.1007/s11013-017-9563-6.
- Kanukollu, S. N.; Epstein-Ngo, Q. Violence against Women through a Buddhist Lens. Religion and Men’s Violence Against Women 2015, 343–355. https://doi.org/10.1007/978-1-4939- 2266-6_21.
- Pattojoshi, A.; Sidan, A.; Garg, S.; Mishra, S. N.; Singh, L. K.; Goyal, N.; Tikka, S. K. “Staying Home Is NOT Staying Safe”: A Rapid 8-Day Online Survey on Spousal Violence against Women during the COVID -19 Lockdown in India. Psychiatry and Clinical Neurosciences 2020. https://doi.org/10.1111/pcn.13176.
- Jain, D.; Sanon, S.; Sadowski, L.; Hunter, W. Violence against Women in India: Evidence from Rural Maharashtra, India. Rural Remote Health 2004, 4 (4), 304. https://doi.org/10.22605/rrh304.
- Heise, L., Ellsberg, M. and Gottemoeller, M. (1999) Ending Violence Against Women. Population Reports, Series L, No.11. http://www.vawnet.org/assoc_files_vawnet/populationreports.pdf
- Jejeebhoy, S. J.; Shah, I.; Thapa, S. Sex without Consent: Young People in Developing Countries; Zed Books, 2005.
- Dhingra, S. Criminalisation of Marital Rape in India. papers.ssrn.com. https://papers.ssrn.com/sol3/papers.cfm?abstract_id=2604919.
- Visaria, L. Violence against Women in India: Is Empowerment a Protective Factor? Economic and Political Weekly 2008, 43 (48), 60–66.
- Chinnakali, P.; George, J.; Nair, D.; Premkumar, N.; Saravanan, N.; Roy, G. The Prevalence of Domestic Violence and Its Associated Factors among Married Women in a Rural Area of Puducherry, South India. Journal of Family Medicine and Primary Care 2016, 5 (3), 672. https://doi.org/10.4103/2249-4863.197309.
- Solanke, B. L.; Bisiriyu, A. L.; Oyedokun, A. Is the Likelihood of Spousal Violence Lower or Higher among Childless Women? Evidence from Nigeria Demographic and Health Surveys. BMC Women’s Health 2018, 18 (1). https://doi.org/10.1186/s12905-018-0514-3.
- vora, M.; Malathesh, B. C.; Das, S.; Chatterjee, S. S. COVID-19 and Domestic Violence against Women. Asian Journal of Psychiatry 2020, 53, 102227. https://doi.org/10.1016/j.ajp.2020.102227.
- Domestic Violence Cases in Chennai Up, Cops Get 25 Calls a Day. The Times of India. April 15, 2020. https://timesofindia.indiatimes.com/city/chennai/domestic- violence-cases-in-chennai-up-cops-get-25-calls-a-day/articleshow/75153610.cms.
- Domestic Violence Calls up from 10 to 25 a Day during Lockdown in Bengaluru. The Times of India. April 10, 2020. https://timesofindia.indiatimes.com/city/bengaluru/domestic-violence-calls-up-from- 10-to-25-a-day-during-lockdown/articleshow/75073669.cms.
- Mukherjee, A. Transmission of Intergenerational Spousal Violence against Women in India. Gender-Based Violence 2015, 215–238. https://doi.org/10.1007/978-3-319-16670-4_10.
- Vung, N. D.; Krantz, G. Childhood Experiences of Interparental Violence as a Risk Factor for Intimate Partner Violence: A Population-Based Study from Northern Vietnam. Journal of Epidemiology & Community Health 2009, 63 (9), 708–714. https://doi.org/10.1136/jech.2008.076968.
- Mona, S. S. and D. S. and. Domestic Violence and Women’s Health in India: Insights from NFHS-4. ORF. https://www.orfonline.org/research/domestic-violence-and-womens-health-in- india-insights-from-nfhs-4/.
- Murthy, P.; Narasimha, V. L. Effects of the COVID-19 Pandemic and Lockdown on Alcohol Use Disorders and Complications. Current Opinion in Psychiatry 2021, 34 (4), 376–385. https://doi.org/10.1097/yco.0000000000000720.
- ********************************************************A*******It******. https://files.eric.ed.gov/fulltext/ED315151.pdf
Reviewers
- Srishti Kapoor, Amity University, Gurgaon (Haryana), sksrishtikapoor28@gmail.com
- Ankita Dave, CSIR-CSMCRI Gujarat, Gurgaon (Haryana), daveankita331@gmail.com
- Mritunjay Sharma, University of Manchester, Gurgaon (Haryana), Mritun_kr90@yahoo.com
Leave a Reply